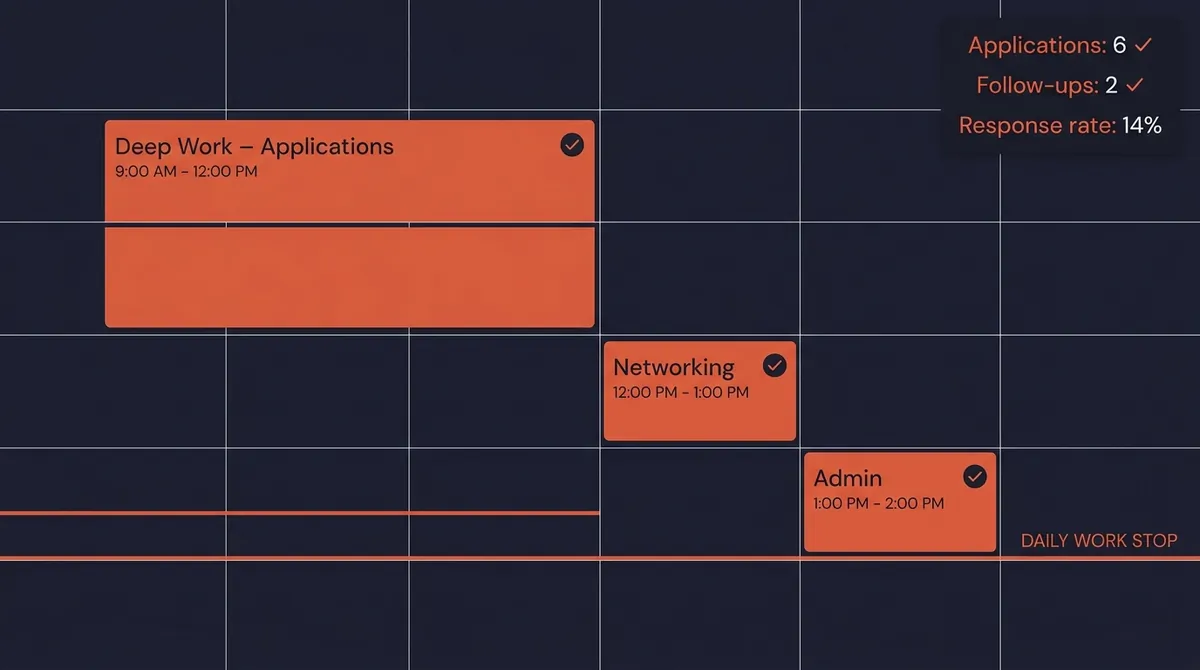
Most job seekers treat their search like a lottery, send out applications, wait, hope. That approach explains why the average search now stretches to 23 weeks (BLS, 2025 mean duration) with no real sense of why it's taking so long. Tracking your job search metrics changes the dynamic entirely. Instead of guessing, you're running a small sales operation on yourself: you know your conversion rates, you can spot where leads are dying, and you can test fixes. This guide walks through exactly which numbers to watch and how to use them.
Why Job Search Metrics Matter More Than Application Volume
The most common piece of advice job seekers get is "apply more." It's also the least useful, because volume without analysis just produces more noise.
Research from CareerPlug's 2025 industry report puts the applicant-to-interview rate at roughly 3%, three callbacks for every hundred applications. The interview-to-hire rate sits around 27%. That math means the end-to-end conversion from application to offer is somewhere between 0.5% and 1.5% for an unoptimized search. Apply 200 times at 1% and you get two offers. Apply 50 times at 6% (a realistic rate for well-targeted applications) and you get three offers with one-quarter the effort.
The difference between those two scenarios isn't luck. It's whether you're paying attention to where your funnel breaks.
The Five Stages of Your Job Search Funnel
Before you can track anything, you need a mental model of the process. Think of your search as a five-stage funnel:
- Applications sent: the top of the funnel; every role you submit to
- Responses received: any acknowledgment beyond an automated rejection, including recruiter screens
- Interviews reached: phone screen, video call, or on-site
- Final-round / offer-stage: you've made it to the last decision point
- Offers received: the close
Each stage has a conversion rate from the stage above it. When you track these numbers weekly, you'll quickly see which conversion is weak. Low response rate? Your resume or targeting is the problem. Good responses but poor interview progression? Your interview performance needs work. Strong final rounds with no offers? Compensation alignment or offer negotiation may be the issue.
The Core Job Search Metrics to Track
1. Application-to-Response Rate
Formula: (Responses ÷ Applications) × 100
A response means any substantive reply, a recruiter email, a screening call request, a LinkedIn message from a hiring manager. Automated rejections don't count.
Industry average: roughly 2–3% for broad job board applications (LoopCV, 2026). Well-targeted applications to mid-size companies through direct outreach can reach 10–20%. If your rate is under 5%, the issue is usually one of three things: your resume isn't passing ATS screening, you're targeting roles where you lack the minimum qualifications, or you're relying entirely on job boards instead of mixing in direct applications and referrals.
2. Response-to-Interview Rate
Formula: (Interviews ÷ Responses) × 100
This metric isolates your performance in the early-stage conversation, usually a recruiter screen. If you're getting responses but not converting them to interviews, your phone screen skills or your LinkedIn profile (which recruiters review before confirming) need attention.
Benchmark: 40–60% is solid. Below 30% suggests a gap between what your resume promises and what you communicate in early conversations.
3. Interview-to-Final-Round Rate
Formula: (Final rounds ÷ First interviews) × 100
This is where preparation shows up in the data. A 50%+ rate here means your interview performance is strong. Below 35% consistently points to either weak answers to behavioral questions or a skills mismatch surfacing mid-process.
4. Final-Round-to-Offer Rate
Formula: (Offers ÷ Final rounds) × 100
This is a high-stakes conversion. A low rate here often means one of three things: another candidate edged you out on technical depth, compensation expectations diverged late, or cultural fit concerns emerged. Tracking when and how you lose here, by asking for feedback, gives you something concrete to fix.
5. Offer-to-Acceptance Rate
You should accept most strong offers, but tracking this helps you recognize if you're consistently getting offers from companies you wouldn't actually join. A sign your targeting is off from the start.
6. Time-per-Stage
How many days between application and first response? Between first interview and final round? The national average time-to-hire has grown to 41 days (up from 33 days in 2021, per hiring data cited by HiringThing's 2025 report). If a process runs well beyond that without explanation, it's stalling, follow up or move on mentally.
How to Set Up Your Tracking System
You don't need sophisticated software. A spreadsheet with the right columns works well. Here's a minimal set of fields:
| Field | Purpose |
|---|---|
| Company | Obvious |
| Role title | For pattern analysis by title |
| Date applied | Calculates time-in-funnel |
| Source | Job board, referral, direct outreach, LinkedIn |
| Current stage | Applied / Responded / Phone screen / Interview / Final / Offer / Rejected / Ghosted |
| Last activity date | Flags stalled processes |
| Next action | What you need to do and when |
| Notes | Recruiter name, compensation range, red flags |
Review this every Sunday. Update stages, flag anything that's been stuck for more than two weeks, and calculate your weekly conversion rates. Fifteen minutes per week generates data that most job seekers never have.
If you'd rather not maintain a spreadsheet manually, OfferFlow's job tracker handles stage tracking, activity logging, and follow-up reminders in one place, useful once you're running 15+ active applications simultaneously.
Reading Your Numbers: What Each Weak Conversion Tells You
Low Application-to-Response Rate (under 5%)
Possible causes:
- Resume not clearing ATS keyword filters, check whether your resume uses the exact terminology from job descriptions
- Over-applying to roles where you miss required qualifications (not just preferred)
- Over-reliance on high-volume platforms where you compete with 250+ applicants per posting
- Applying to roles at companies with internal candidates already identified
Fix: Narrow to 10–15 roles per week where you meet 80%+ of requirements, and mix in 3–5 direct outreach messages to hiring managers or team members per week. Quality of application matters more than quantity past a certain point.
Low Response-to-Interview Rate (under 30%)
Possible causes:
- LinkedIn profile doesn't match or reinforce the resume
- Screening call performance, energy, framing your background, asking relevant questions
- Salary expectations communicated too early and misaligned
Fix: Practice your 90-second professional summary aloud until it sounds natural. Review your LinkedIn headline and summary to make sure they reinforce your resume's story.
Low Interview-to-Final-Round Rate (under 35%)
This is the most information-rich failure point because you can often get direct feedback here.
Possible causes:
- Behavioral answers are vague or too short (no STAR structure)
- Technical questions are exposing a genuine skill gap
- Poor questions asked at the end of the interview
Fix: Run mock interviews with a peer or record yourself answering common questions. For technical roles, identify the three hardest skills listed in job descriptions you're targeting and shore them up specifically.
Low Final-Round-to-Offer Rate
When you're consistently getting to the final round and losing, the problem is usually marginal. Another candidate was slightly stronger, or you misread the role's priorities. Ask every final-round rejection for feedback. Many interviewers will give you honest input when asked directly by email within 24 hours of the decision.
Weekly Review Ritual
Set aside time every Sunday evening to run through these steps:
- Update all stages in your tracker
- Calculate week-over-week conversion rates for application-to-response and response-to-interview
- Flag stalled processes: anything without movement in 14 days needs a follow-up or a mental close
- Set next week's targets: how many applications, how many outreach messages, how many follow-ups
- Note one hypothesis: "I think my phone screen is weak because I'm not asking good questions", and test one change
This ritual transforms a passive process into an active one. When your metrics don't move despite effort, you have data to take to a career coach or a peer. When they improve, you know what to keep doing.
Setting Realistic Benchmarks for Your Search
One caution: benchmarks are averages, and averages can mislead. A software engineer at a major tech company in San Francisco operates in a different market from a supply chain manager in a mid-size Midwest city.
The more useful frame is your own trend line. Your application-to-response rate in week four should be better than in week one if you're learning from the data. If it's not improving after six weeks, something structural needs to change, your resume, your target companies, your role level, or how you're sourcing opportunities.
According to BLS data, the average search duration in 2025 reached 23 weeks for those tracking unemployment. That's the baseline reality. Job seekers who approach their search analytically, tracking metrics, testing changes, doubling down on what works, consistently outperform that average. It's not complicated. It just requires treating the search like work.
Using Source as a Metric
One of the most overlooked data points is where your successful applications come from. Track the source column in your spreadsheet and look at it monthly:
- Employee referrals convert at 4–5x the rate of job board applications, according to data from multiple recruiting studies
- Direct outreach to hiring managers on LinkedIn, when personalized, generates response rates of 15–25% in many industries
- Job boards (Indeed, LinkedIn) generate the most volume but the lowest per-application conversion because the competition pool is largest
Most job seekers discover after six weeks of tracking that 80% of their effort goes to the channel with the worst results. Shifting even 20% of application time toward referral-building and direct outreach often moves the overall funnel more than doubling application volume.
For role-specific preparation that can improve your interview conversion rate, OfferFlow's interview question guides cover common questions by role, and the cover letter builder can help you tailor applications faster so you can apply with higher quality at reasonable volume.
Common Tracking Mistakes
Counting applications, not outcomes. Activity metrics (applications sent) feel productive. Outcome metrics (interviews per application) are what matter. Track both, but optimize toward outcomes.
Not recording rejections. A clean tracker only shows active opportunities. Include all applications, including rejections and ghosted roles. You can't calculate conversion rates without the denominator.
Updating the tracker only when things go well. Ghosting and rejection feel bad to log. Log them anyway. That data is often the most actionable.
Tracking without reviewing. Numbers in a spreadsheet that you never read are just administrative overhead. The weekly review ritual is where tracking becomes useful.
What Your Funnel Numbers Should Look Like
Here's a rough target state for an active, optimized job search in a moderate market:
- Application-to-response: 8–12%
- Response-to-interview: 45–55%
- Interview-to-final-round: 40–50%
- Final-round-to-offer: 35–50%
Running those numbers: if you apply to 40 well-targeted roles in a month, you'd expect 4–5 responses, 2–3 interviews, 1–2 final rounds, and a real shot at one offer. That's a realistic trajectory for a focused four-to-six week sprint in a competitive market, much better than submitting 200 applications with no framework for improvement.
The job search doesn't have to feel like a black box. Every number in your funnel is feedback. Start tracking this week, run your first weekly review in seven days, and you'll have more clarity about what to change than most job seekers get in three months of searching.
For a centralized place to track stages, contacts, and follow-ups across every application, start a free OfferFlow account. The kanban board is built specifically for managing the application-to-offer pipeline.